很困難,但有可能嗎? 2100年暖化1.5°C內的新途徑 | 環境資訊中心
國際新聞

很困難,但有可能嗎? 2100年暖化1.5°C內的新途徑

2018年04月25日
摘譯自2018年3月5日Carbon Brief報導;姜唯編譯;趙家緯審校

2015年巴黎氣候協議中,幾乎所有國家都承諾,要將全球暖化控制在「保持全球均溫較前工業化時代的升幅遠低於2℃」,並「努力將溫度升幅限制在1.5℃內」。

然而,當時科學家們只能模擬能源系統和碳減排途徑如何實現2℃目標。很少有研究探討世界如何限制升溫於1.5℃內。

現在一篇刊登於《自然氣候變遷》的論文介紹了一種新模擬方法,運用六種不同的「整合性評估模型」(integrated assessment model,IAM)將2100年全球升溫限制1.5℃以下。

結果顯示,如果全球碳排放量在未來幾年達到高峰,並且在本世紀下半葉運用碳捕集與封存生物能源(BECCS)技術從大氣中吸收大量碳排,1.5℃是可以實現的。

COP21 環團要求升溫限制在1.5度

COP21 環團要求升溫限制在1.5度。圖片來源:Takver(CC BY-SA 2.0)

定義1.5C目標

抑制升溫於1.5℃以內目標面臨的一個挑戰是,巴黎協定條文並未明確定義之。例如,科學家們對工業化前的溫度究竟是多高、何為最適定義,以及使用什麼資料集持不同意見。

到底目標是2100年有50%的機會達到升溫1.5℃以內就好,或是更努力避免達到升溫1.5℃,也沒有明確的共識。因為氣候敏感度存在高度不確定性,也就是每增加一倍的二氧化碳排放量,暖化幅度可能達到1.5℃至4.5℃之間,科學家往往以最壞情況,也就是氣候敏感度達到最高的情況來模擬。

在2℃目標的情況下,巴黎協定中的「遠低於」被解釋為確保超過2℃的概率不超過33%,也就是說有66%的可能性低於該目標。但是1.5℃目標可以被解釋為保持低於1.5℃的概率為50%,或是與2℃目標類似的66%。這聽起來差別似乎不大,但其實影響碳預算和達標難易度甚鉅。

在新論文中,23位能源研究人員組成的團隊選擇更嚴謹的解釋,目標是在2100年避免暖化超過1.5℃的可能性為66%。然而,他們允許在整個過程中升溫可以超過1.5℃,只要在2100年前回落到1.5℃以下,即所謂的「超越限度」(overshoot)情景。

只有某些途徑可能達到升溫1.5℃內

為評估將升溫1.5℃的可行途徑,研究人員使用為預計於2021年初出版的IPCC第六次評估報告所研發的「共享社會經濟途徑」(Shared Socioeconomic Pathways,SSPs)。提出五種未來世界可能的樣貌,在人口、經濟增長、能源需求、社會平等和其他因素方面都存在差異。

每一種世界都可能有多種不同的氣候軌跡,某些比較容易減排,某些比較難。避免2100年暖化超過1.5℃的新氣候軌跡被稱為 「代表性濃度途徑1.9」(Representative Concentration Pathway,簡稱RCP1.9),這個情境下,溫室氣體引起的輻射強度限制在每平方米比工業前水平高1.9瓦(W/m2)以內,低於過去氣候建模者使用的RCP2.6到8.5W/m2。

六個IAM都可以在SSP1中找到可行的1.5℃情境,可以說SSP1是注重「包容性和永續發展」的途徑。六個模型中的四個模型可在SSP2中實現,SSP2屬中間路線,主要遵循歷史模式。在SSP3中沒有模型可以實現1.5℃目標,這是一個「國際競爭」和「復興民族主義」的世界,沒有太多國際合作。

最後,只有一個模型在SSP4中可能實現1.5℃目標,這是一個「高度不平等」的世界,有兩個模型在SSP5這個「快速經濟增長」和「能源密集型生活方式」的世界中具有可行的途徑。

排放量必須盡快達到峰值

要將暖化限制在1.5℃以下,研究人員檢視的所有模型都要求全球排放量必須在2020年達到峰值,此後急劇下降。2050年後,全世界必須將二氧化碳淨排放量減少至零,並且在整個21世紀下半葉,排放量必須保持趨負。

即使在這些迅速減排的情況下,到2040年,所有情境仍會超過1.5℃的升溫幅度,到2100年降至工業化前水平以上1.3-1.4℃左右。更快速減排的模型——通常是SSP1相關模型——溫度超過限度的幅度比漸進式模型小。

下圖顯示了所有1.5℃模型的CO2排放量(上)和工業化前水準以上的暖化幅度(下)。線條顏色顯示不同的SSP。

在羅傑等人2018年研究中,所有RCP1.9 / 1.5℃情境中的二氧化碳排放量,單位為10億噸(Gt)CO2(上)和相對於工業化前(下)的全球平均地表溫度。資料來自IIASA SSP資料庫。圖表為Carbon Brief用Highcharts製作。

這些模型顯示了從2018年到2100年剩餘的1.5℃「碳預算」,介於-1750到4000億噸二氧化碳(GtCO2)之間。這個範圍與IPCC第五次評估報告的估計一致。

這個範圍之所以很廣,是非二氧化碳溫室氣體(如甲烷和一氧化二氮)排放量的差異造成。到了2100年,這些溫室氣體的排放量在不同模型間差異可達二至三倍。一些非二氧化碳排放量較高的模型剩餘碳預算小於零,世紀末需要從大氣中移除二氧化碳。在這些模擬中,1.5℃的碳預算已經用完。

整合所有模型的估計結果是,2018-2100年1.5℃目標的剩餘碳預算約為2300億噸二氧化碳。按目前的排放速率,大約六年就耗盡,不同模型計算結果在0到11年之間。

用再生能源代替化石燃料

這份研究也探討了滿足全球能源需求,同時減少溫室氣體排放量以達到1.5℃目標的可能性。達到1.5℃目標需要全球迅速淘汰所有類型的化石燃料,或者至少淘汰沒有碳捕獲和封存(CCS)技術的化石燃料。同時還需要迅速提高使用零碳淨能源和淨負碳能源的使用,像是整合探捕獲和封存技術的生質能源(Bio-energy with carbon capture and storage,BECCS),同時實際從大氣中去除二氧化碳。

下圖顯示了所有1.5℃模型的再生能源(左),淨負BECCS(中間)和沒有CCS的煤(右)的使用。顏色是模型中的不同SSP。

renew-beccs-coal
所有RCP1.9 / 1.5℃情境下的全球主要能源使用狀況(艾焦),包括非生質再生能源(左)、BECCS(中)和無CCS(右)的燃煤。 改編自羅傑等人2018年研究的圖2。

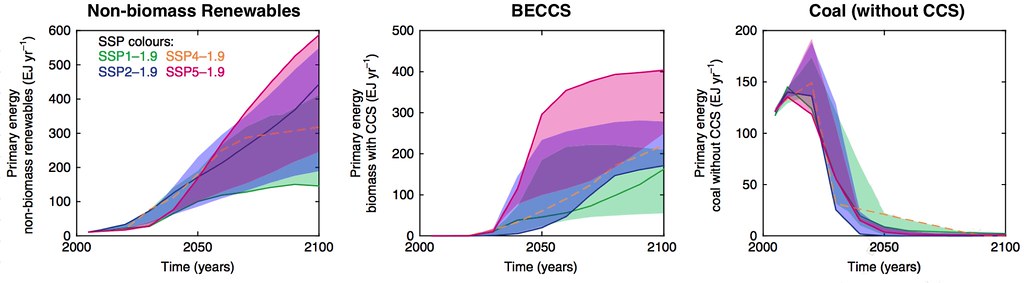
在大多數模型中,整體能源使用量實際上在2018年至2100年之間增加了-22%至+83%,中間值是22%。

然而,模型也顯示能源效率在短期內相當重要,至少當化石燃料仍是能源大宗時相當重要。尤其在交通和建築部門,因其急速去碳化的困難度比電力部門高。

模型顯示2050年全球所有能源60-80%來自再生能源。有些模型顯示核電很重要,但有些模型則不然。

要限制升溫至1.5℃,2040年無碳捕獲的煤炭使用率要下降大約80%,到2060年,石油也要幾乎被淘汰。也就是說大部分汽油或柴油車輛在2060年之前得被淘汰,電動車與低碳替代燃料汽車變成大宗。未來天然氣的使用在模型中差異較大,本世紀中葉有些增加有些減少。

排放量必須趨負

本世紀下半葉必須達到負排放,從大氣中抽出過剩二氧化碳。因為模型中的排放無法快速下降至1.5℃的碳預算以下。大多數模型的排放量比本世紀的允許排放量多出50-200%。

這些模型假設從2030年到2040年間BECCS開始廣泛被採用,並迅速擴大規模。到2050年,許多模型的BECCS產量超過100艾焦(EJ),大致相當於今日煤炭提供的能量。到2100年,BECCS達到200EJ,而所有非生質再生能源達到300EJ。

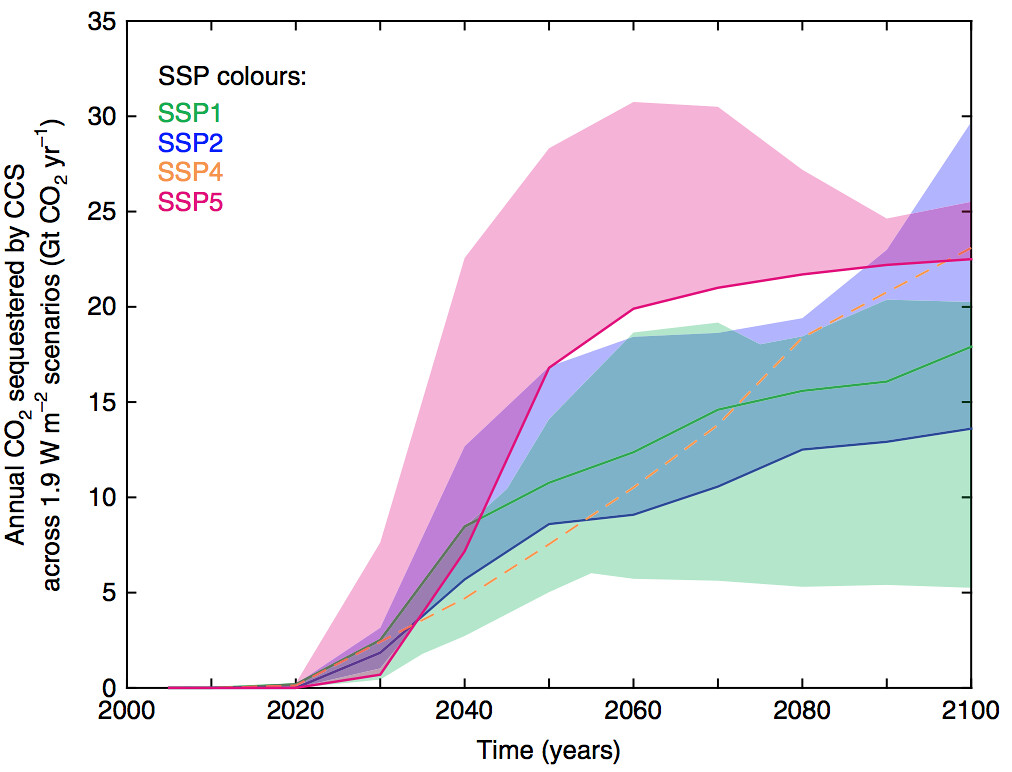
下圖顯示了所有模型中CCS(包括BECCS和化石燃料)封存的二氧化碳量。碳捕獲在2020年之後開始增加,到本世紀末達到20 GtCO2或更高,約是2018年全球二氧化碳排放量的一半左右。

negative-emissions
所有RCP1.9 / 1.5℃情境中,各種SSP之下,每年二氧化碳捕獲和封存量,單位為千兆噸(Gt)。 改編自羅傑等人2018年研究的圖3。

模型預測今天至2100年間的全球森林覆蓋率變化介於-2%至26%,大多數模型顯示森林覆蓋率顯著增加。BECCS和造林都需要大量的土地。大多數模型顯示,全球農田縮減幅度大致等於整個歐盟目前用於農業的土地面積。

然而,研究中使用的大多數模型未考慮造林做為減排手段,因此造林和其他自然負排放技術未來可能發揮更大的作用。未來會用哪些負排放技術尚未確定,可能不像模型如此依賴BECCS,但由於成本和規模效益不確定,非BECCS方法大多被排除在模型之外。

同樣地,應用BECCS的程度在不同模型和不同SSP之間差異很大,SSP1要求最少的負排放,SSP5要求最多,因為其減排較慢,整體能源消耗較高。

本研究第一作者、奧地利國際應用系統分析研究所(IIASA)羅格里(Joeri Rogelj)博士告訴Carbon Brief:「這顯示著重限制能源需求的永續生活方式,可以大大減少對BECCS的依賴。」

1.5℃情境一個有趣的結果是,與2℃情境相比,化石燃料結合CCS的應用反而較少。這是因為具備CCS的化石燃料仍然會導致煤礦開採或天然氣處理產生甲烷排放,以及捕獲和洩漏不完全造成的二氧化碳排放。這些額外的排放量可能會變得太顯著,無法在1.5℃情境下大規模運用。

1.5℃比2℃更難以達到

除了探索達成1.5℃目標的條件之外,這份研究還將其與目前不同類別的2℃情境進行比較。下圖顯示了1.5℃和2℃情境的成本指標和減排指標差異。每個虛線表示達成1.5℃所需的成本或努力比2℃高100%。

change-from-2c
各種SSP中,1.5℃情境的成本和減排指標相對2℃情境的增加幅度。每條虛線代表成本或減排量增加100%,最高可增加到500%。 取自羅傑等人2018年研究的圖4。

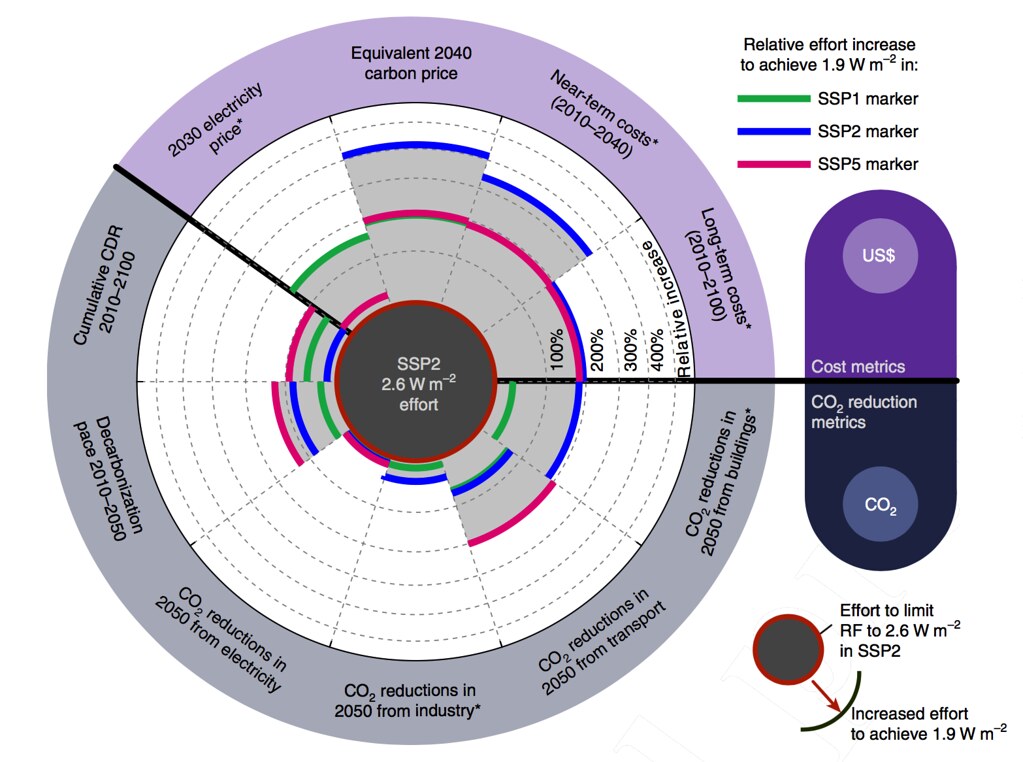
碳價格漲幅最大,必須在200%至400%之間,而近期成本則要高出200%至300%以上。短期成本的增加是短期內更激烈減排所導致。長期成本預計也會高出約200%。

對於二氧化碳減排指標,1.5℃世界需要在建築和交通方面減少二到三倍的二氧化碳排放量。這些產業比發電更難以除碳,因為它們涉及的化石燃料直接燃燒難以被取代

困難,但可能嗎?

這項研究中的新情境很重要,因為它們顯示,的確有可能的軌跡和技術發展途徑能讓2100年升溫1.5℃以下。然而,所有這些模型都顯示本世紀中葉升溫會超過1.5℃。此外,大多數模型中,本世紀稍後應用的負碳排技術效果未經證實,近期內是否真能藉此逐步減少排放量仍是個問號。

New scenarios show how the world could limit warming to 1.5C in 2100

In the 2015 Paris Agreement on climate change, nearly every country on Earth pledged to keeping global temperatures “well below” 2C above pre-industrial levels and to “pursue efforts to limit the temperature increase even further to 1.5C”.

However, at the time, scientists had only modelled energy system and carbon mitigation pathways to achieve the 2C target. Few studies had examined how the world might limit warming to 1.5C.

Now a paper in Nature Climate Change presents the results from a new modelling exercise using six different “integrated assessment models” (IAMs) to limit global temperatures in 2100 to below 1.5C.

The results suggest that 1.5C is achievable if global emissions peak in the next few years and massive amounts of carbon are sucked out of the atmosphere in the second half of the century through a proposed technology known as bioenergy with carbon capture and storage (BECCS).

島國心聲 # COP21 升溫不超過1.5度。

島國心聲,COP21 升溫不超過1.5度。攝影:賴慧玲。

Defining the 1.5C target

One challenge with the goal of limiting warming to 1.5C above pre-industrial levels is that it was not clearly defined in the text of the Paris Agreement. For example, scientists disagree on what, exactly, pre-industrial temperatures were and how best to define them, as well as what dataset to use.

There is also not a clear consensus if the target should be to aim to have even odds of the world reaching 1.5C warming by 2100, or seek to try and avoid having temperatures exceed 1.5C by aiming for an even lower warming amount. Because uncertainties in climate sensitivity mean that we could have anything between 1.5C and 4.5C warming per doubling of CO2 emissions, scientists tend to plan to avoid the worst case where climate sensitivity ends up being on the higher end of the range.

In the case of the 2C target, the Paris Agreement’s “well below” language has been interpreted as ensuring that there is no more than a 33% chance of exceeding 2C – and, therefore, a 66% chance of staying below it. But the 1.5C target could be interpreted as either aiming for a 50% chance of staying below 1.5C, or a 66% chance similar to the 2C target. This may sound like a small distinction, but it has large impacts on the resulting carbon budget and ease of meeting the target.

In their new paper, a team of 23 energy researchers choose the stricter interpretation of the target, aiming for a 66% chance of avoiding more than 1.5C warming in the year 2100. However, they allow for temperatures to exceed 1.5C over the course of the century as long as they fall back down to below 1.5C by the year 2100. This is known as an “overshoot” scenario.

1.5C only possible in some future pathways

To assess viable pathways to limit warming to 1.5C, the researchers use the new Shared Socioeconomic Pathways (SSPs) developed in preparation for the next Intergovernmental Panel on Climate Change (IPCC) assessment report due early next decade. These SSPs – which Carbon Brief will explore in more depth in the coming weeks – present five possible future worlds that differ in their population, economic growth, energy demand, equality and other factors.

Each world could have multiple different climate trajectories, though some will have a much easier time reducing emissions than others. The new climate trajectory associated with avoiding more than 1.5C warming in 2100 is called Representative Concentration Pathway 1.9 (“RCP1.9”), which is a world where the radiative forcing from greenhouse gases is limited to no more than 1.9 watts per meter squared (W/m2) above pre-industrial levels. This is lower than the range of RCPs previously used by climate modellers, which went from 2.6 up to 8.5W/m2.

The six IAMs all find viable 1.5C scenarios in SSP1, which is a pathway that focuses on “inclusive and sustainable development”. Four of the six models find pathways in SSP2, which is a middle of the road scenario where trends largely follow historical patterns. No models show viable 1.5C pathways in SSP3, which is a world of “regional rivalry” and “resurgent nationalism” with little international cooperation.

Finally, only one of the models has a 1.5C pathway in SSP4, which is a world of “high inequality”, while two models have viable pathways in SSP5, a world of “rapid economic growth” and “energy intensive lifestyles”.

Emissions must peak quickly

To limit warming to below 1.5C, all the models that the researchers examined require that global emissions peak by 2020 and decline precipitously thereafter. After 2050, the world must reduce net CO2 emissions to zero and emissions must be increasingly negative throughout the second half of the 21st century.

Even with these rapid reductions, all the scenarios considered still overshoot 1.5C warming in the 2040s, before declining to around 1.3-1.4C above pre-industrial levels by 2100. Models with more rapid reductions – generally associated with SSP1 – have less temperature overshoot than those with more gradual reductions.

The figure below shows both CO2 emissions (left) and global warming above pre-industrial (right) across all the 1.5C models examined. The lines are coloured based on the SSP used.

CO2 emissions in gigatons (Gt) CO2 (left) and global mean surface temperature relative to preindustrial (right) across all RCP1.9/1.5C scenarios included in Rogelj et al 2018. Data available in the IIASA SSP database. Chart by Carbon Brief using Highcharts.

The models show a remaining 1.5C “carbon budget” from 2018 to 2100 of between -175 and 400 gigatonnes of CO2 (GtCO2). This range is consistent with estimates from the IPCC’s 5th Assessment Report.

The wide range is largely a result of differences in emissions of non-CO2 greenhouse gases, such as methane and nitrous oxide, which vary by a factor of between two and three across the models by 2100. Some models with higher non-CO2 emissions have a remaining carbon budget of less than zero, requiring more CO2 to be removed from the atmosphere than added by the end of the century. In these simulations, the carbon budget for 1.5C has already been used up.

The central estimate across the models is that the remaining 2018-2100 carbon budget is around 230 GtCO2. At the current rate of emissions, this would allow roughly six years until the entire 1.5C budget is exhausted, with a range of zero to 11 years across all the models.

Replacing fossil fuels with renewables

The study explores the different ways that global energy needs can be met, while also cutting GHG emissions in order to meet the 1.5C goal. Limiting warming to below 1.5C requires that the world rapidly phase out all types of fossil fuels – or at least those without accompanying carbon capture and storage (CCS). At the same time, the world need to quickly ramp up the use of zero and net-negative carbon energy sources – things such as BECCS that generate energy while actually removing CO2 from the atmosphere.

The figure below shows the use of renewables (left), net-negative BECCS (centre) and coal without CCS (right) across all the 1.5C models. The colours show which SSPs the model simulations use.

Global primary energy use in exajoules (EJ) for non-biomass renewables (left), BECCS (center), and coal without CCS (right) across all RCP1.9/1.5C scenarios. Adapted from Figure 2 in Rogelj et al 2018.

In most models, overall energy use actually increases between 2018 and 2100, by between -22% and +83%, with a central increase of 22%.

However, the models also show that energy efficiency is quite important in the short term – at least, while most energy comes from fossil fuels. This is particularly important in the transportation and building sectors, where rapid decarbonisation is more difficult than in power generation.

The models show an estimated 60-80% of all energy coming from renewables globally by 2050. Some models also show a much larger role for nuclear power, though others do not.

To limit warming to 1.5C, coal use without carbon capture declines by around 80% by 2040, with oil similarly mostly phased out by 2060. This would require most petrol or diesel vehicles to be phased out by 2060, with electric or other low-carbon alternative fuel vehicles making up the vast majority of sales well before that date. Future natural gas use is more mixed in the models, with some showing increases and some decreases by mid-century.

Emissions must go negative

Negative emissions are needed in the latter half of the century to pull the extra CO2 out of the atmosphere. This is because emissions cannot fall fast enough in the models to avoid exceeding the allowable carbon budget to avoid 1.5C warming.

Most of the models emit roughly 50-200% more CO2 than the allowable carbon budget over the course of the century, before pulling the extra CO2 back out.

The models assume widespread adoption of BECCS starting between 2030 and 2040 and then rapidly scaling up. By 2050, many models have BECCS producing more than 100 exajoules (EJ), roughly the same amount of energy globally as coal provides today. By 2100, BECCS will be around 200EJ compared to 300EJ for all non-biomass renewable energy.

The figure below shows the amount of CO2 sequestered by CCS (both from BECCS and fossil fuels) across all the models. Carbon capture ramps up after 2020 and could be 20 GtCO2 or higher by the end of the century, which is around half of global CO2 emissions in 2018.

Annual CO2 sequestered by carbon capture and storage in gigatons (Gt) CO2 by year and SSP across all RCP1.9/1.5C scenarios. Adapted from Figure 3 in Rogelj et al 2018.

The models produce estimates of global forest cover changes between -2% and 26% between today and 2100, with most models showing significant increases in forest cover. Both BECCS and afforestation require a lot of land. Most models show a decline in global cropland scenarios roughly equal to the area currently used for agriculture across the entire European Union.

However, most of the models used in the study do not include afforestation as an explicit mitigation option, so afforestation and other “natural” negative emissions technologies could potentially play a larger role in the future. The specific technologies used for future negative emissions may be different and somewhat less reliant on BECCS, but non-BECCS approaches are largely excluded from the models due to remaining uncertainties in cost and effectiveness at scale.

Similarly, the amount of BECCS used differs quite a bit between models and across SSPs, with SSP1 requiring the least negative emissions and SSP5 requiring the most due to its slower emissions reductions and higher overall energy use.

Dr Joeri Rogelj, the paper’s lead author from the International Institute for Applied Systems Analysis (IIASA) in Austria, tells Carbon Brief:

“This indicates that a focus on sustainable lifestyles that limit energy demand can strongly reduce the reliance on BECCS.”

One interesting consequence of the 1.5C target is a reduced use of fossil fuels combined with CCS, compared to what is found in 2C scenarios. This is because fossil fuels with CCS still results in methane emissions from coal mining or gas handling, as well as CO2 emissions due to imperfect capture and leakage. These extra emissions can become too important to allow at a large scale in a 1.5C world.

Much more difficult to reach 1.5C than 2C

In addition to exploring the details of what it would take to limit warming to 1.5C, the paper also compares it to existing 2C scenarios across a number of different categories. The figure below shows the difference between 1.5C and 2C scenarios across both economic and CO2 reduction metrics. Each dashed line represents a 100% increase in cost or effort in a 1.5C world compared to a 2C world.

Relative increases in cost and CO2 reduction metrics for 1.5C scenarios compared to 2C scenarios for various SSPs. Each dashed line represents a 100% increase in cost or reduction amount, up to a 500% increase. Taken from figure 4 in Rogelj et al 2018.

The largest increases are in carbon prices, which must be between 200% and 400% higher, and in near-term costs, which are 200% to over 300% higher. These increases in short-term costs are driven by the more severe near-term emission reductions needed. Long-term costs are also expected to be around 200% higher.

For CO2 reduction metrics, a 1.5C world requires approximately two to three times larger reductions in CO2 from buildings and transport than in a 2C world. These sectors are more difficult to decarbonise than power generation as they involve the direct combustion of fossil fuels that are less easily replaced.

Difficult, but possible?

The new scenarios in this study are important because they show that there are possible trajectories and technological pathways that can limit warming to below 1.5C in 2100. However, all of the models included overshoot 1.5C of warming in the middle of the century. Most also rely on massive amounts of still-unproven negative emissions later in the century to allow a more feasibly gradual reduction in emissions in the near-term.

※ 全文及圖片詳見:Carbon BriefCC BY-NC-ND 4.0

作者

姜唯

如果有一件事是重要的,如果能為孩子實現一個願望,那就是人類與大自然和諧共存。

趙家緯

台大環工所博士,現為台灣環境規劃協會理事長、台大氣候變遷與永續發展國際學程兼任助理教授。長期參與台灣氣候與能源政策之公共討論,近期聚焦於台灣淨零轉型路徑規劃。